
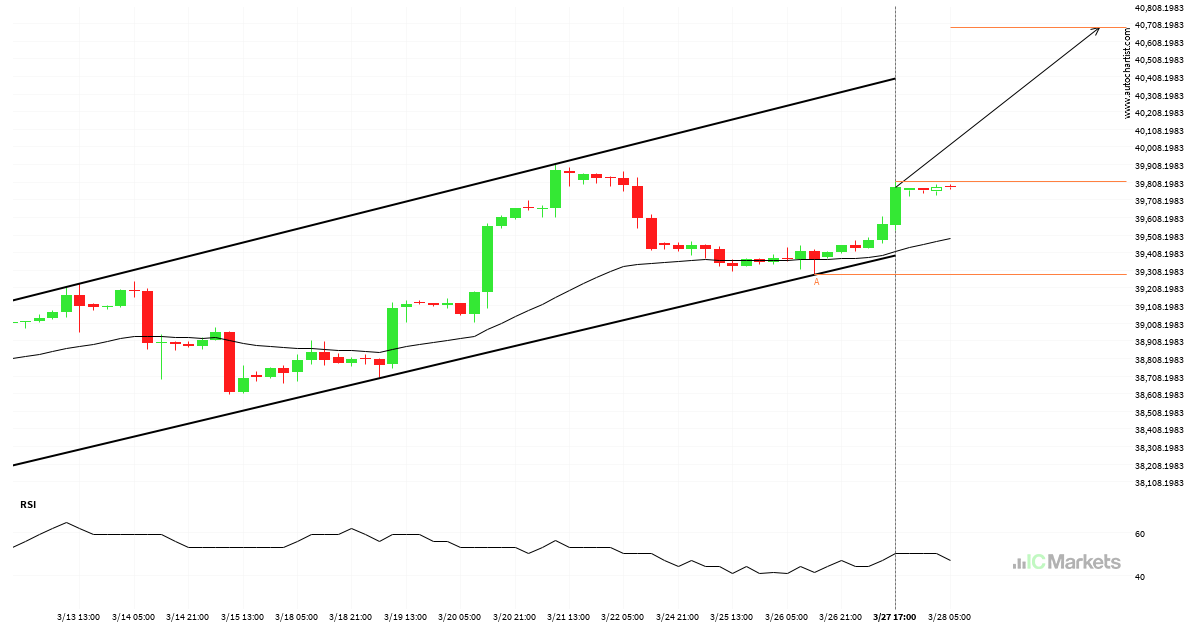
US Wall Street 30 Index – Continuation Padrão gráfico – Canal ascendente
Um Canal ascendente emergente foi detectado em US Wall Street 30 Index no gráfico 4 hora. Há um possível movimento em direção ao 40684.1286 nas próximas velas. Uma vez atingindo support, pode continuar sua tendência bullish ou reverter para os níveis atuais de preço.
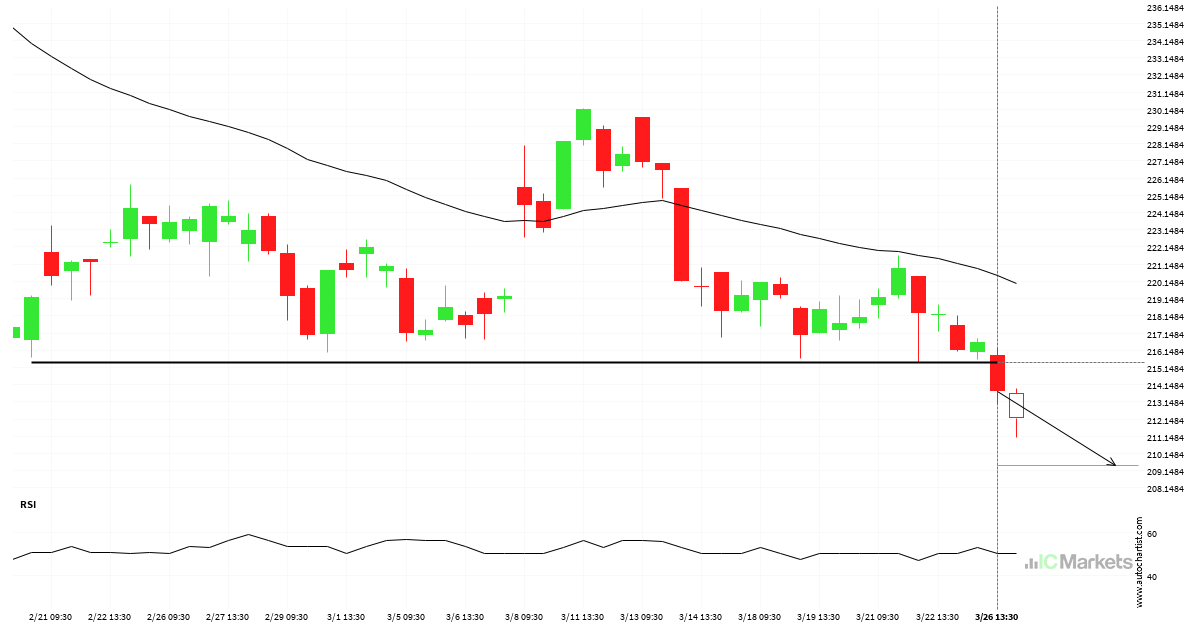
Biogen Idec Inc Nível visado: 209.4740
Rompeu Apoiar nível de 215.4450 em 26-mar-2024 13:30 EDT

US SPX 500 Index Nível visado: 5252.0850
Rompeu Resistência nível de 5239.5498 em 26-mar-2024 05:30 EDT
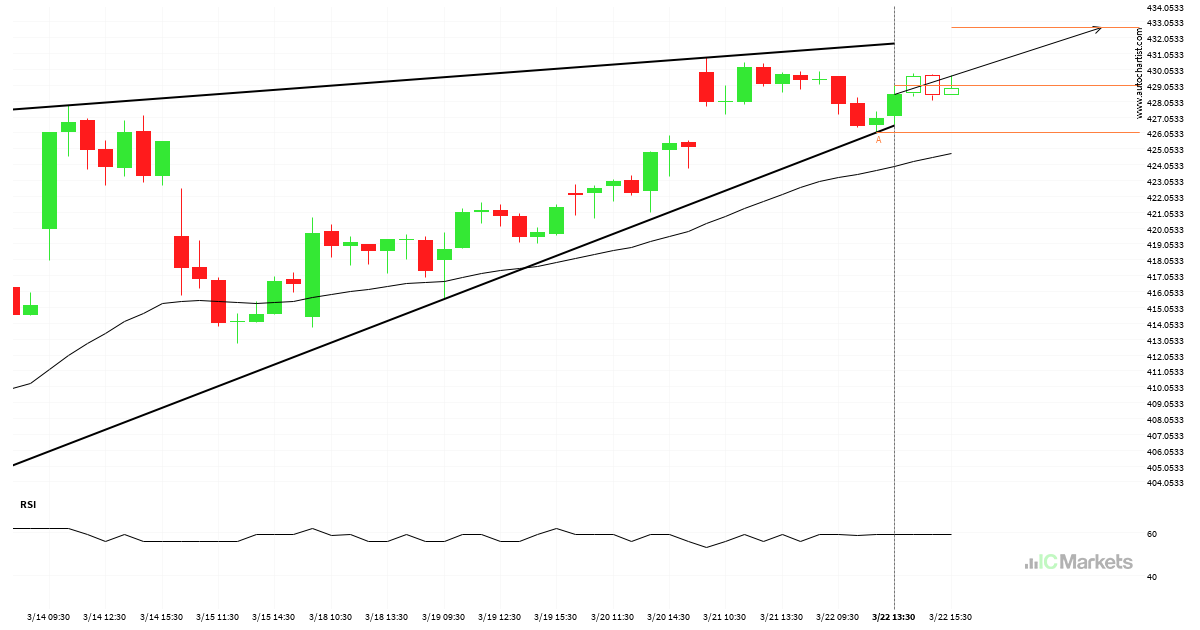
Microsoft Corporation – Continuation Padrão gráfico – Cunha ascendente
Um Cunha ascendente emergente foi detectado em Microsoft Corporation no gráfico 1 hora. Há um possível movimento em direção ao 432.6753 nas próximas velas. Uma vez atingindo support, pode continuar sua tendência bullish ou reverter para os níveis atuais de preço.
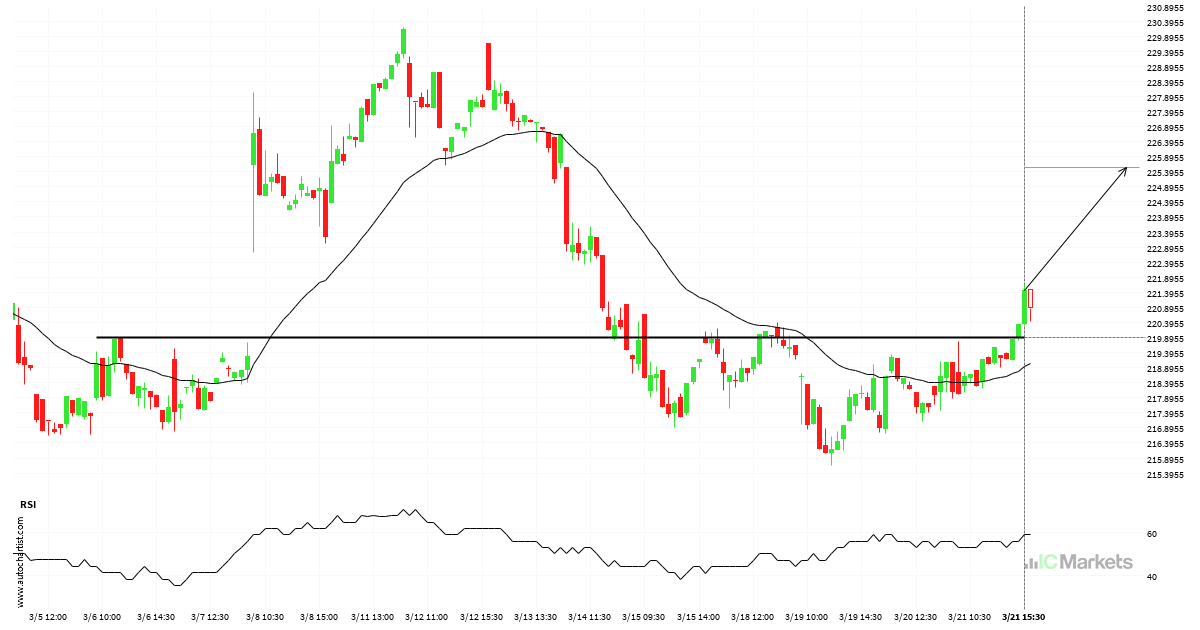
Biogen Idec Inc Nível visado: 225.5415
Rompeu Resistência nível de 219.9000 em 21-mar-2024 15:30 EDT
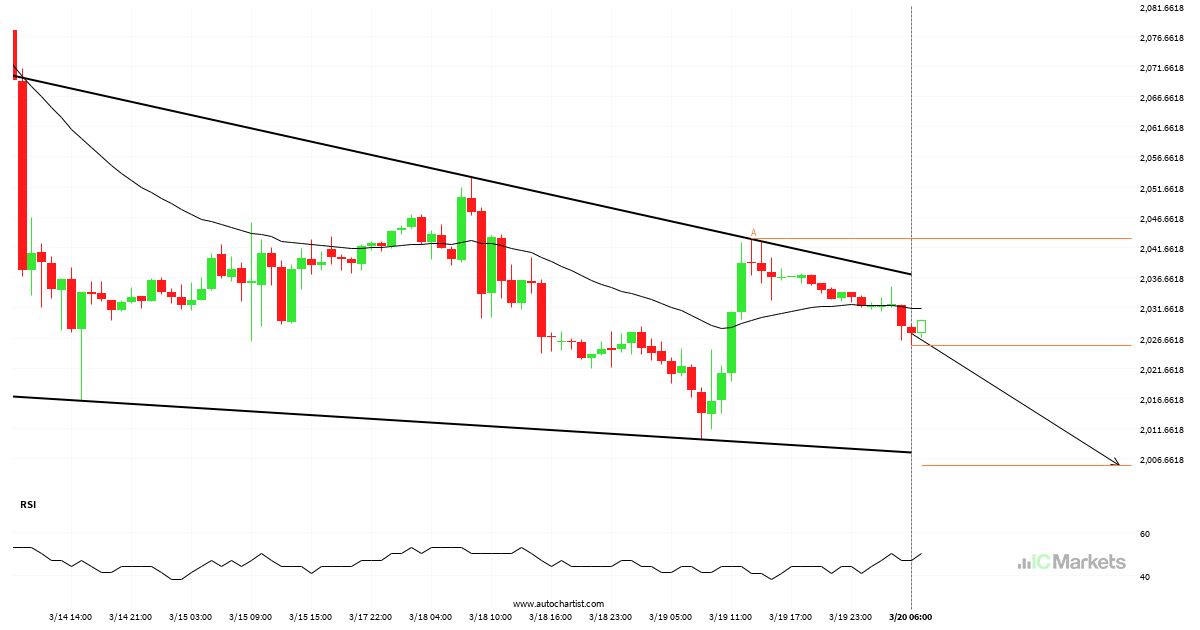
US Small Cap 2000 Index – Continuation Padrão gráfico – Cunha descendente
Um Cunha descendente emergente foi detectado em US Small Cap 2000 Index no gráfico 1 hora. Há um possível movimento em direção ao 2005.6038 nas próximas velas. Uma vez atingindo resistance, pode continuar sua tendência bearish ou reverter para os níveis atuais de preço.
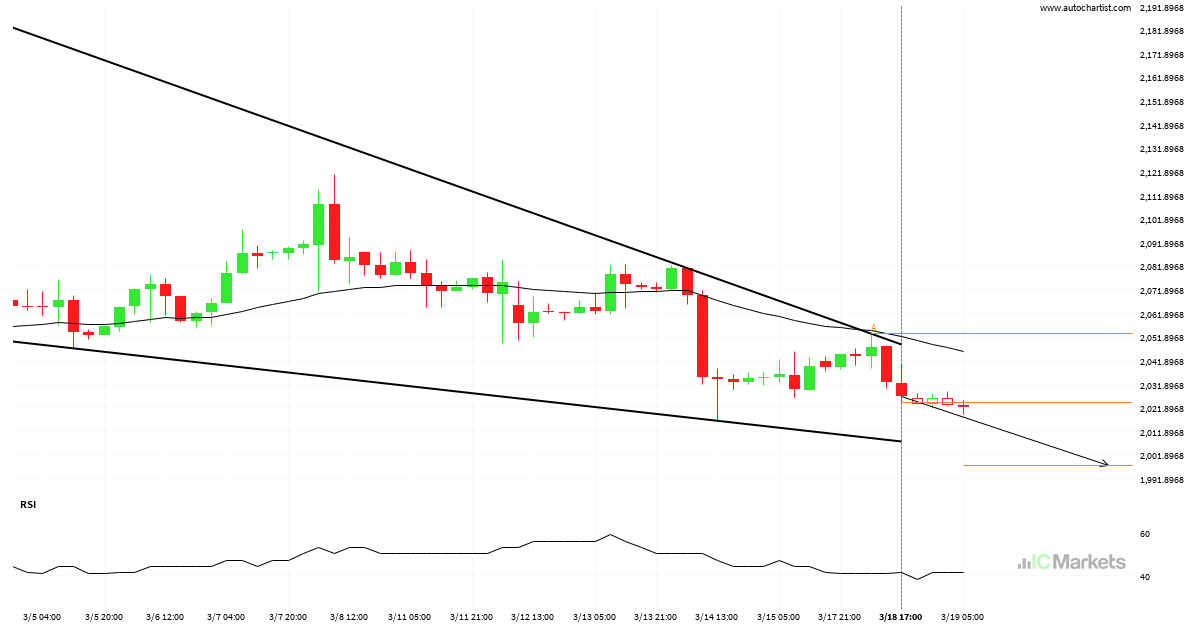
US Small Cap 2000 Index – Continuation Padrão gráfico – Cunha descendente
Um Cunha descendente emergente foi detectado em US Small Cap 2000 Index no gráfico 4 hora. Há um possível movimento em direção ao 1997.5739 nas próximas velas. Uma vez atingindo resistance, pode continuar sua tendência bearish ou reverter para os níveis atuais de preço.
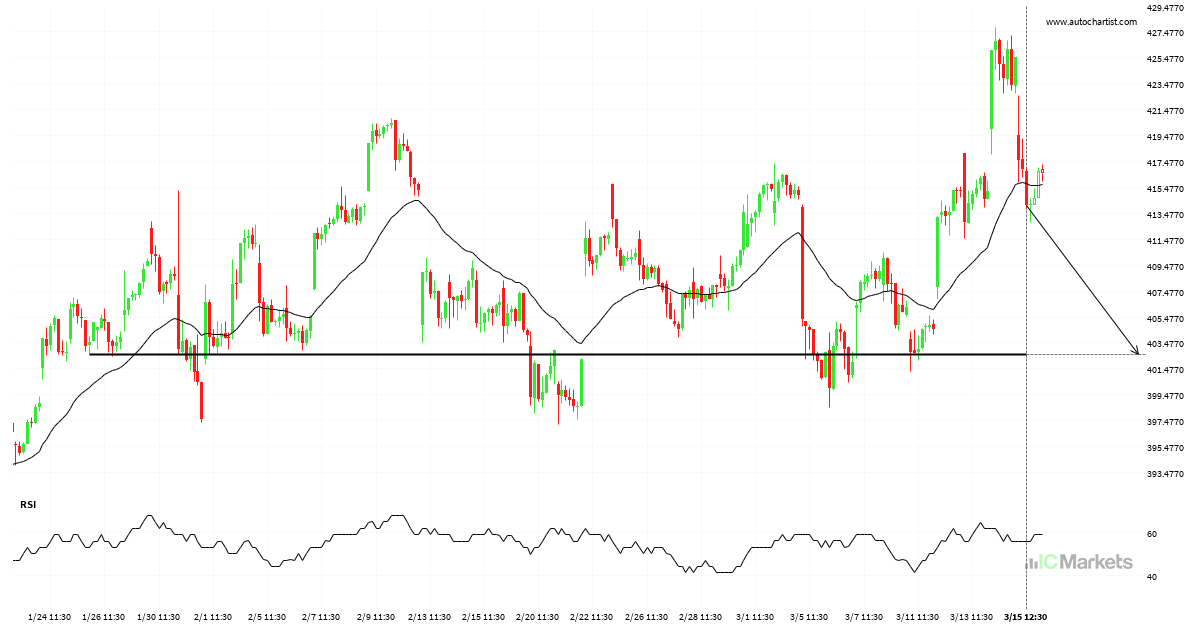
Microsoft Corporation Nível visado: 402.5500
Aproximando-Apoiar nível de 402.5500 identificado em 15-mar-2024 12:30 EDT

US Small Cap 2000 Index Nível visado: 2014.7248
Triângulo Descendente quebrou na linha de suporte em 14-mar-2024 13:00 EDT. Possível previsão de movimento em baixa nos próximos dia para 2014.7248
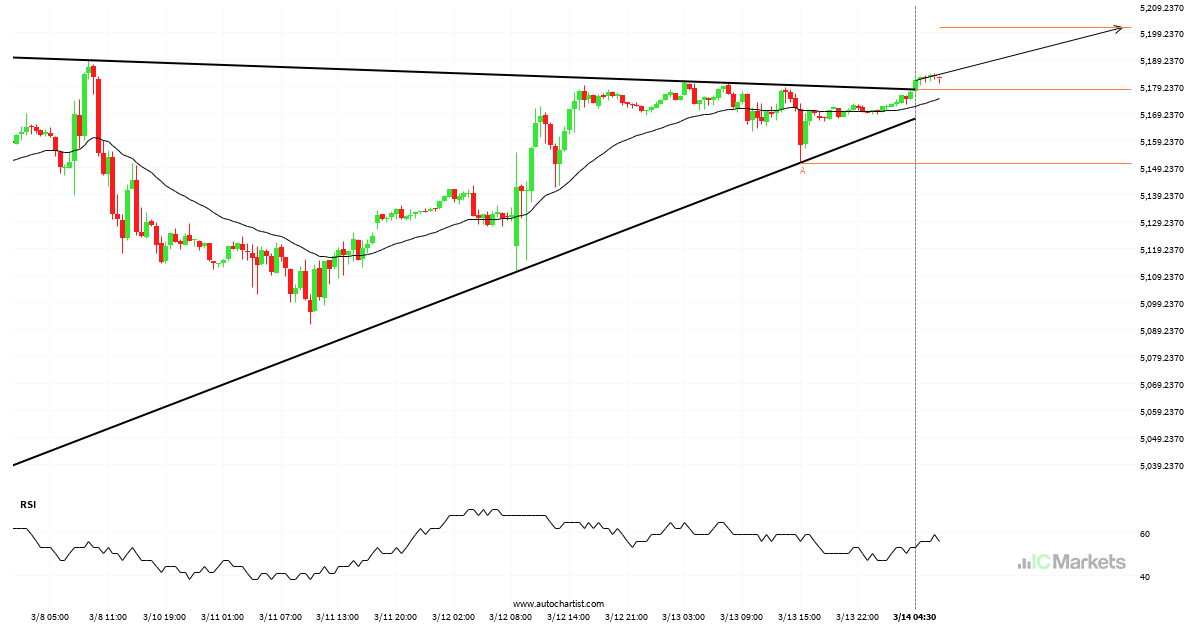
US SPX 500 Index Nível visado: 5201.1295
Triângulo quebrou na linha de resistência em 14-mar-2024 04:30 EDT. Possível previsão de movimento em alta nos próximos dia para 5201.1295